
Mastering Cloverleaf: Building and Customizing Insurance Data Models
Hello insurance data analytics enthusiasts! With Cloverleaf’s powerful modeling capabilities, you have various options to build and customize your insurance data models. Whether you’re deciding on a modeling approach, data source, or the complexity of your data pipeline, I want to help you understand how much impact choosing the right modeling techniques can have on your analytics work.
Using effective data modeling not only ensures insurance data integrity and accessibility but also allows for more insightful analysis and better decision-making. One question you should always ask yourself when designing a data model is, “What insights am I trying to enable?” This becomes the main driver for creating a model that not only processes data efficiently but also drives action and starts meaningful conversations within your organization.
Let me share some approaches I’ve found helpful when building data models:
Select the Right Modeling Approach for Your Needs
Cloverleaf offers a variety of modeling options in the Model module – from Smart Model and Direct Model to Model Lite and Model Pro. Not all approaches will be suitable for every scenario. Knowing which modeling method best fits your particular insurance data needs is essential for creating a meaningful analytics foundation.
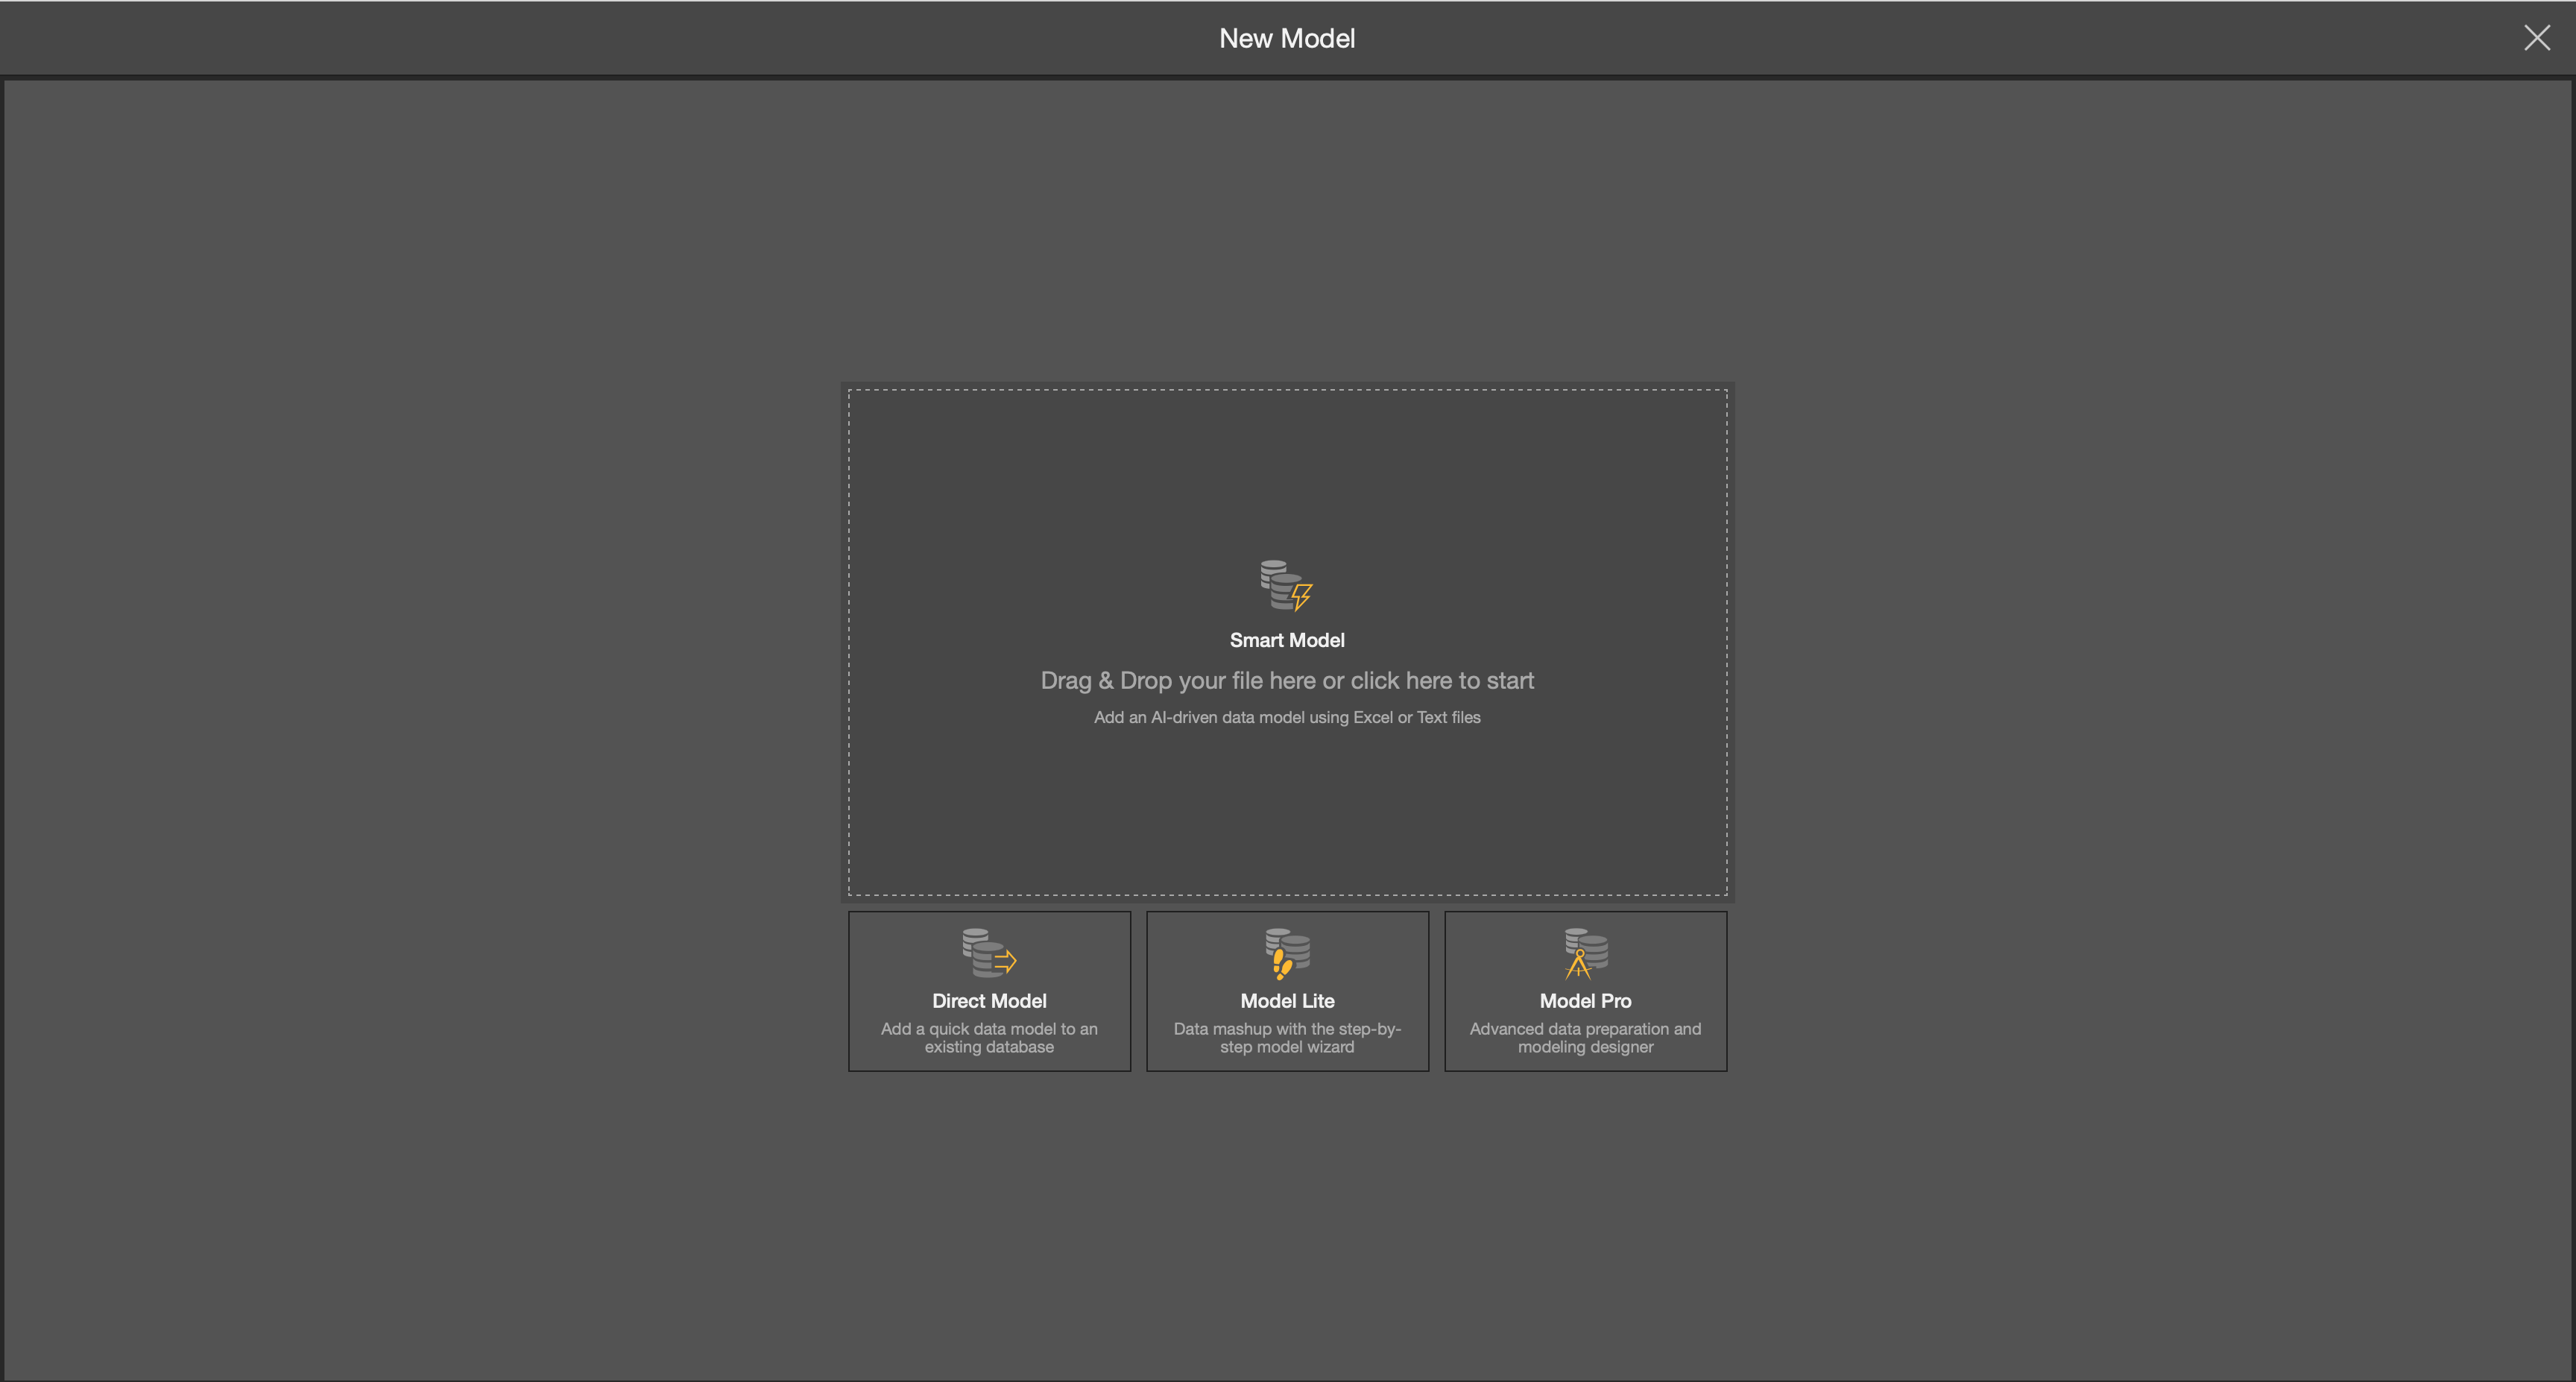
- Smart Model allows for users to import a file as the data source and Cloverleaf will automatically build the model and use heuristics to automatically determine joins in the relationship.
- Direct Model can be used when users are looking to add a new semantic model to an existing database. This tool is used to query the data source, not ingest data.
- Model Lite allows users to create a model via a point and click interface. This option also allows for customization of joins, columns, and to build hierarchies.
- Model Pro allows for users to build a pipeline of your data through the data flow. Functions include scripting, column operations, data preparation and etc.
Building a Data Pipeline in Model Pro
In this section, I’ll walk you through creating a data pipeline using Model Pro’s intuitive canvas interface. When you open Model Pro, you’re presented with a blank canvas where your insurance data analytics journey begins.
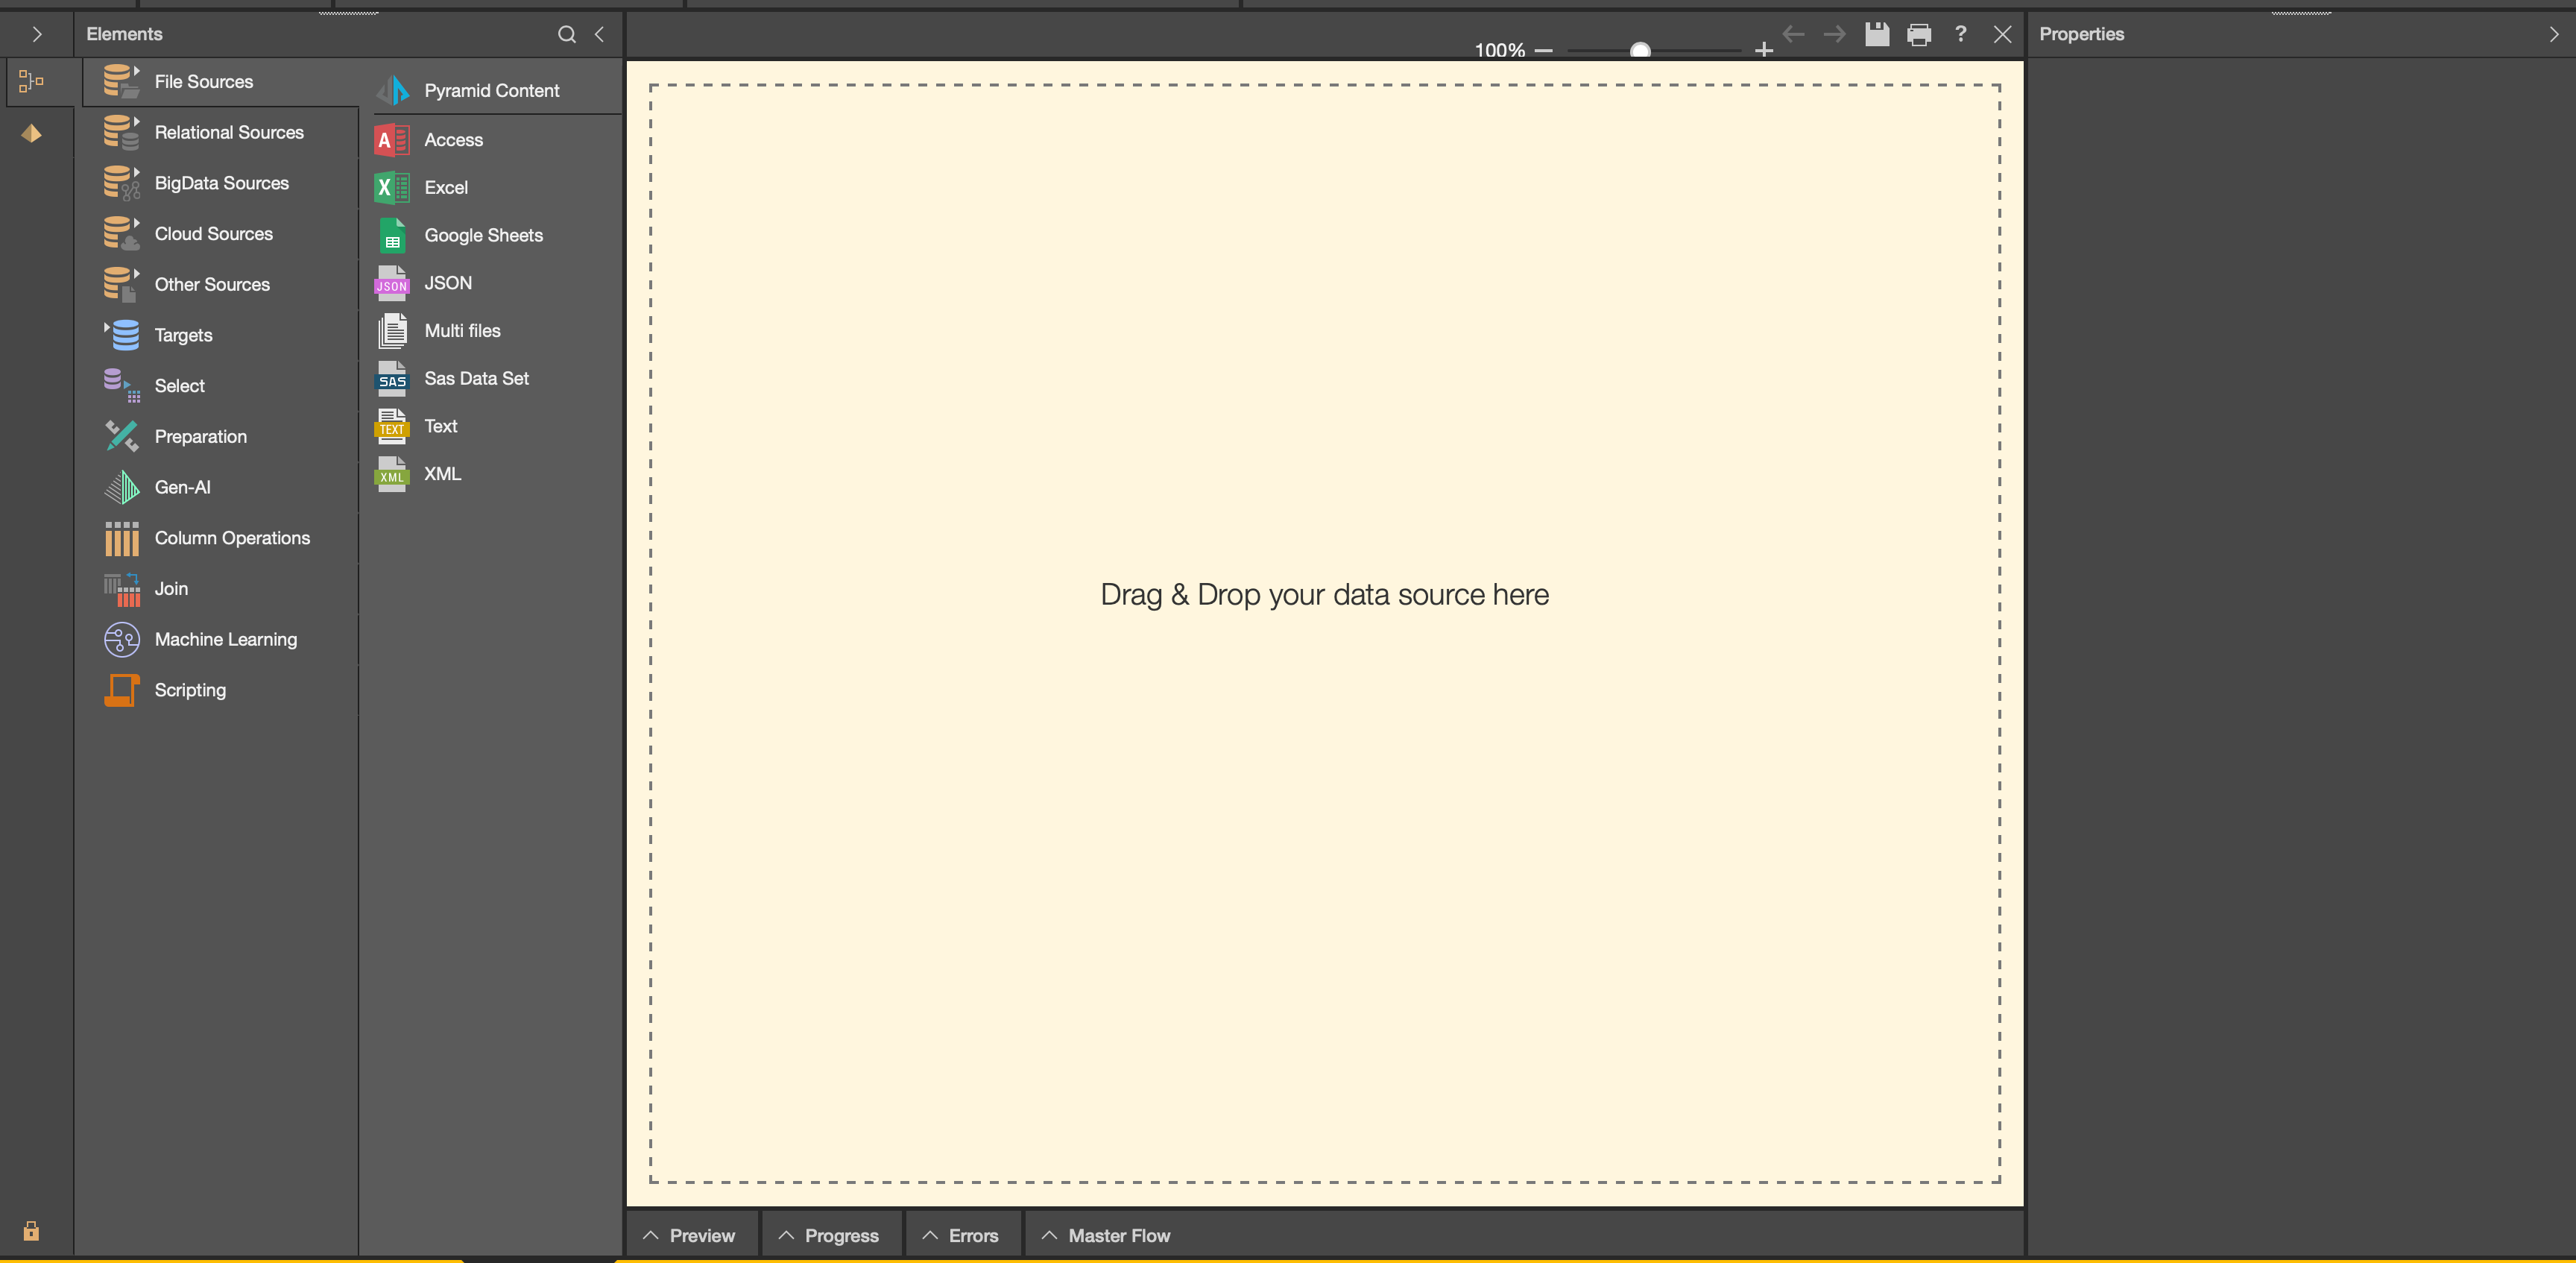
On the left side of the screen, you’ll find all the element nodes that can be added to build your data pipeline. Starting with data source options, you can either read or import data via files (like Excel), relational databases (such as Snowflake), or Big Data/Cloud sources (like Google or Facebook).
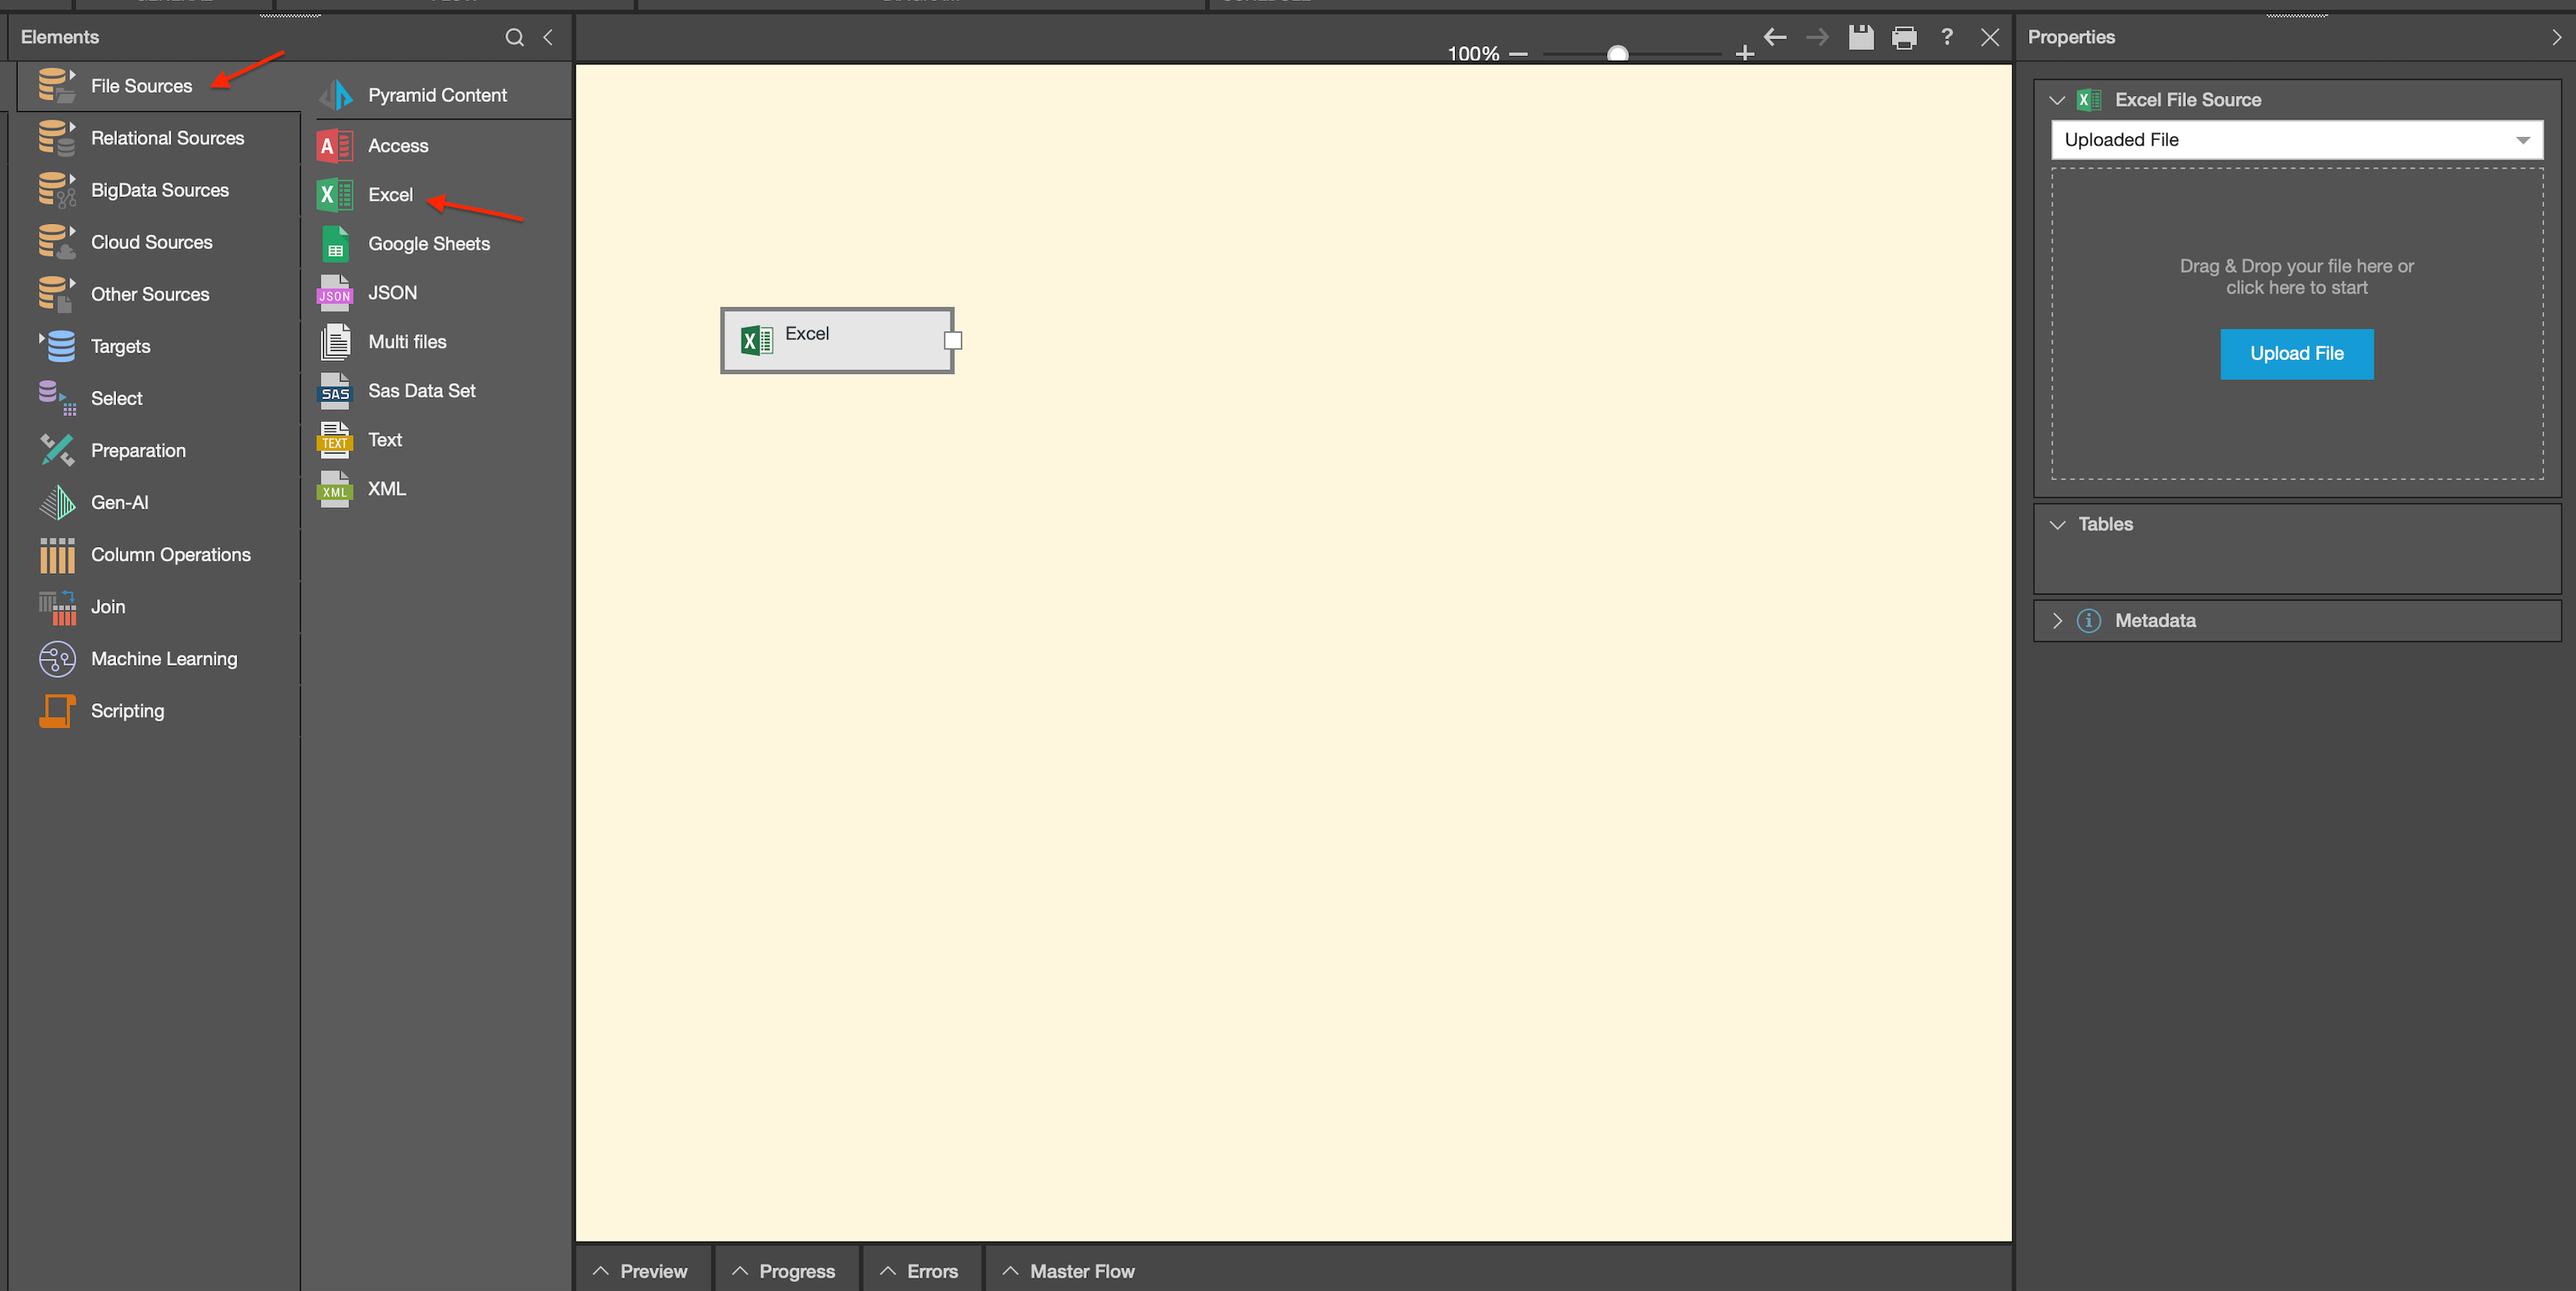
To import an external Excel document, simply select the tab and drag the Excel node onto the canvas.
After uploading your desired file, each tab from your Excel document will appear as a table in the tables panel.
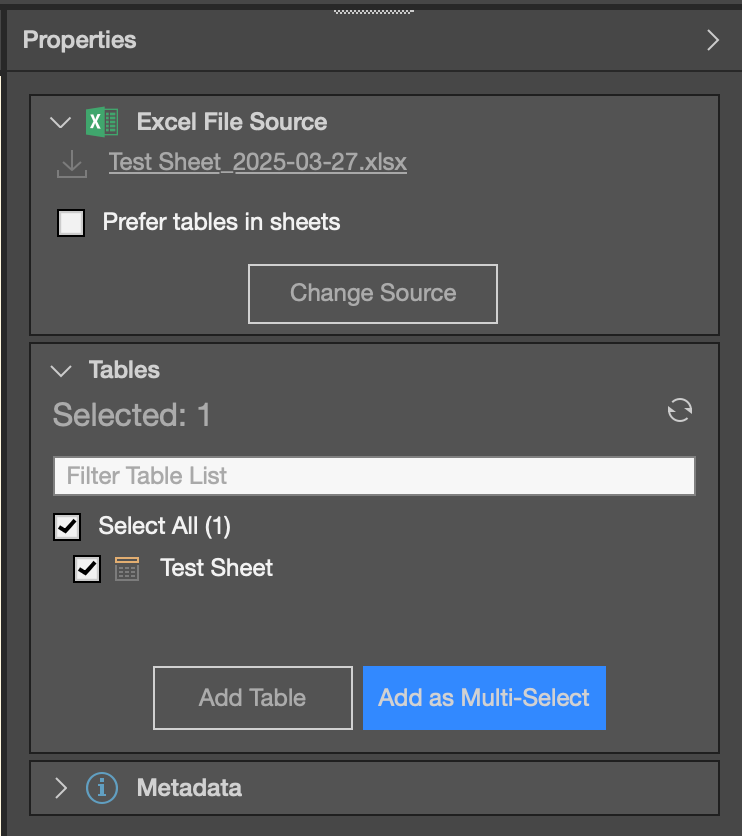
Select the tables you wish to include, click “add table,” and watch as your canvas updates with your data.
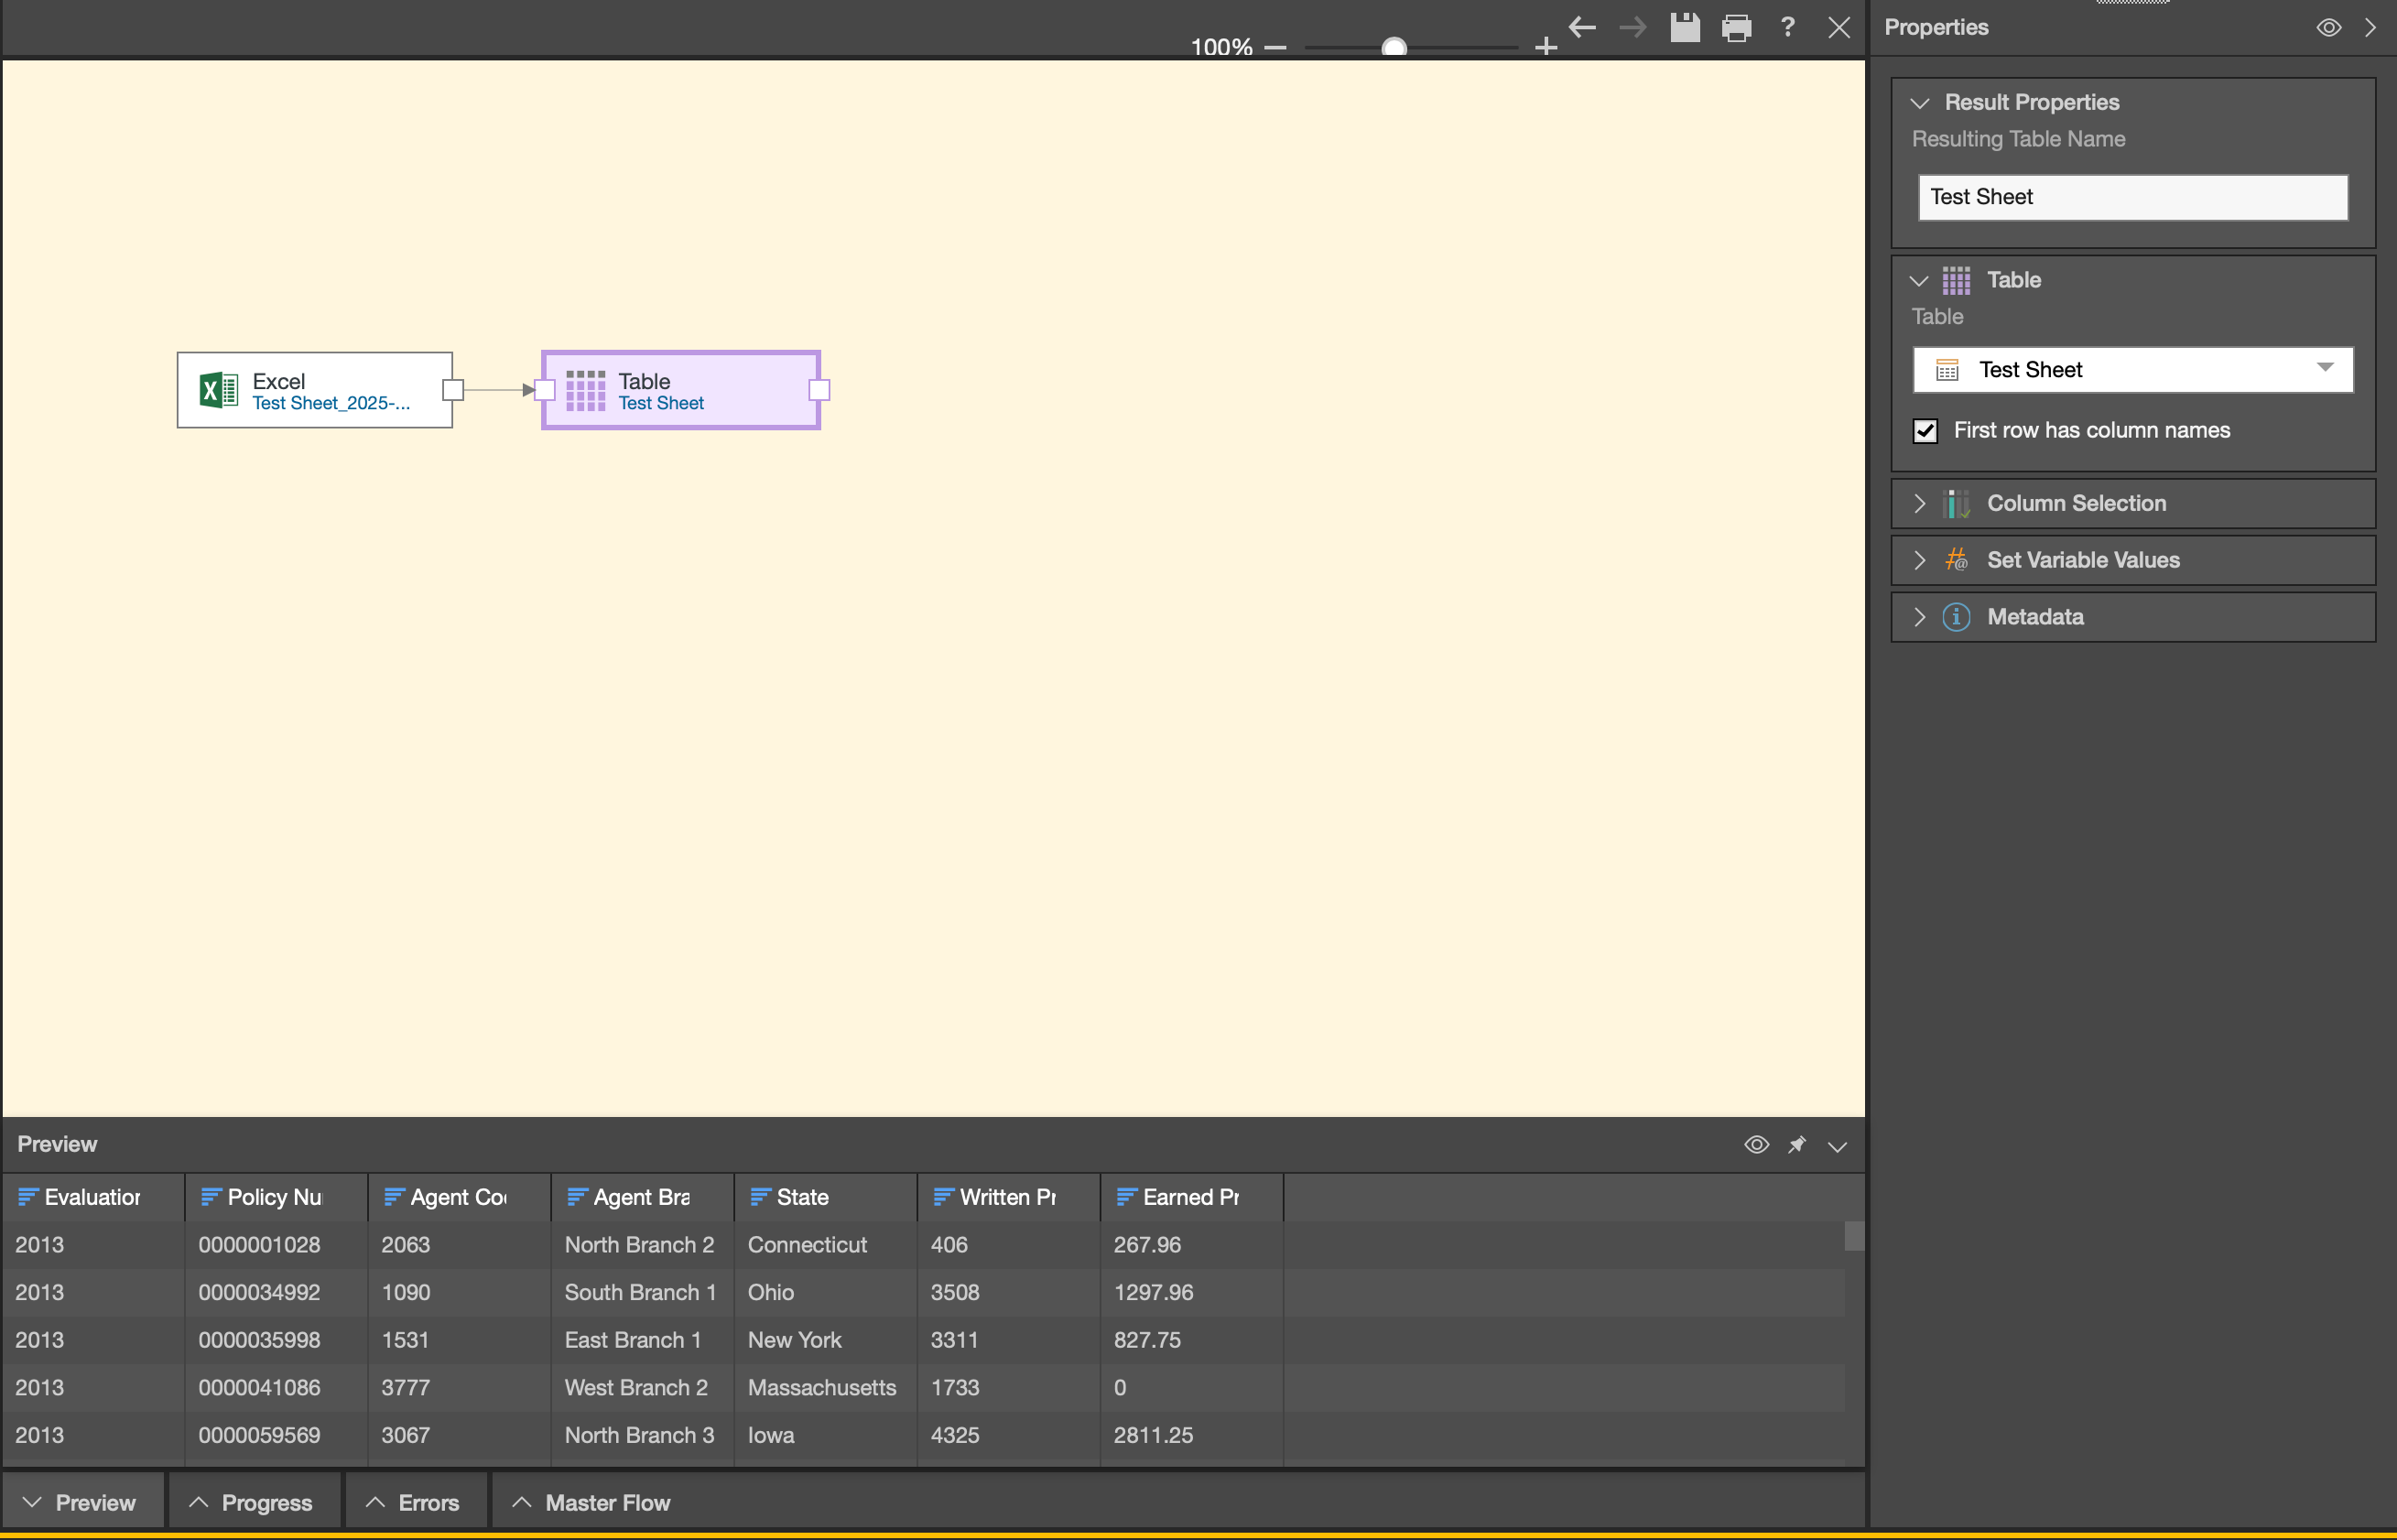
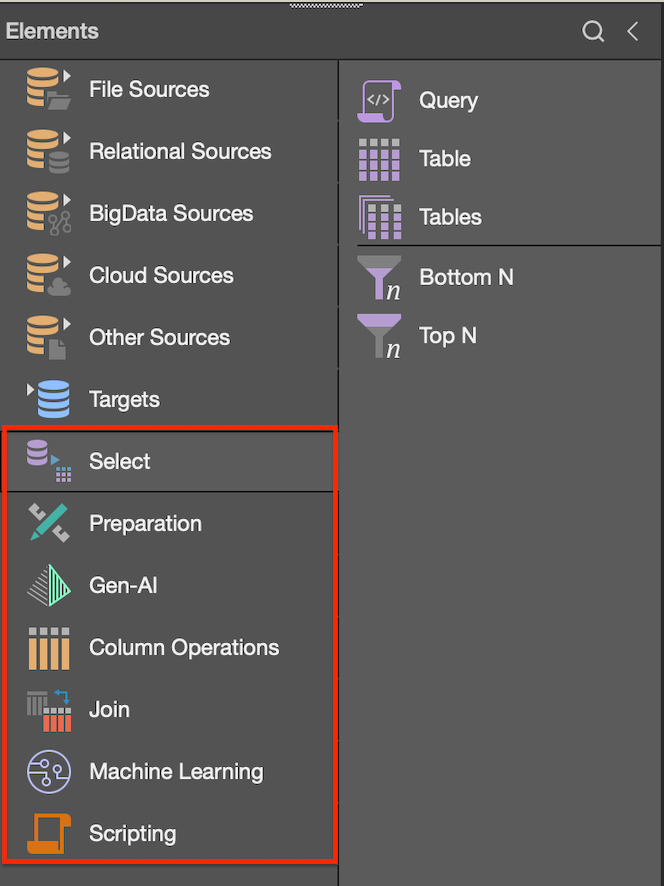
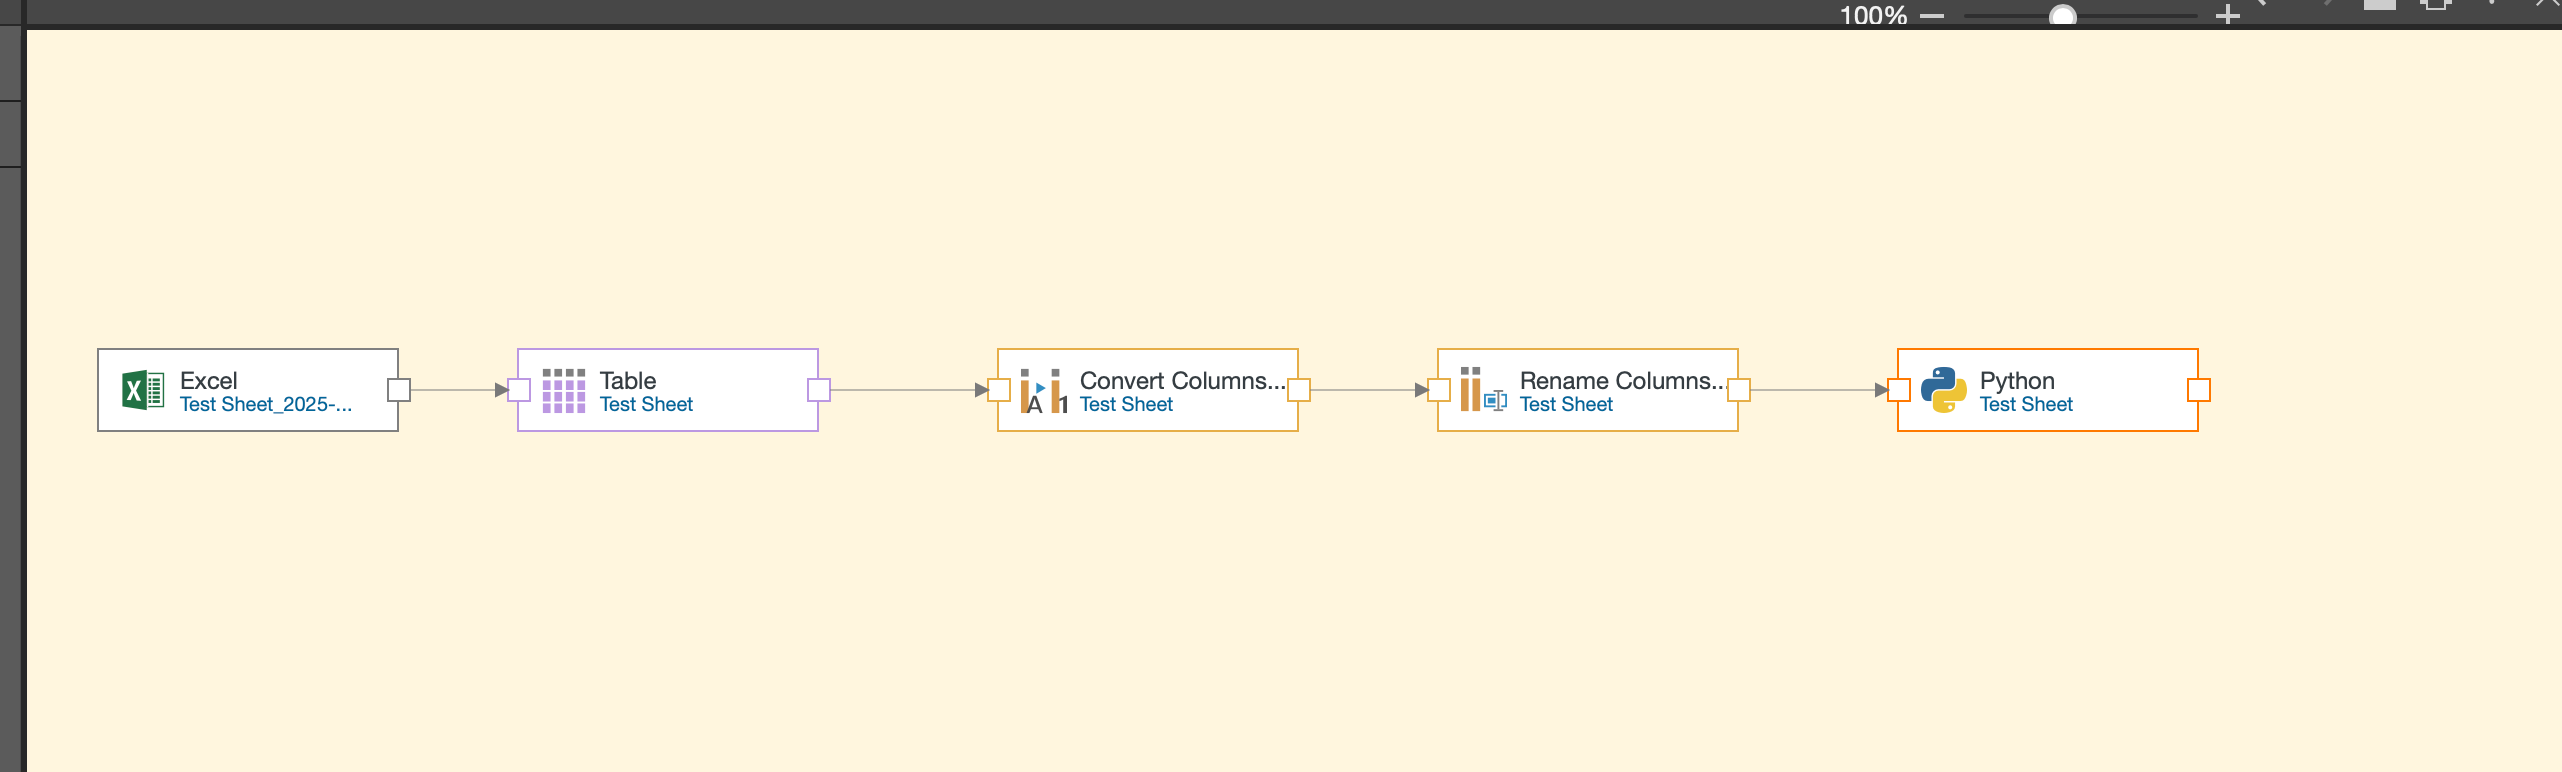
Once your table node appears on the canvas, clicking it will display a preview of your data in the preview panel at the bottom of the screen. Now the fun part begins – you can enhance your data using various preparation features available in the element tab, including select, preparation, Gen-AI, column operation, or scripting nodes.
Customize Your Data with Column Operations
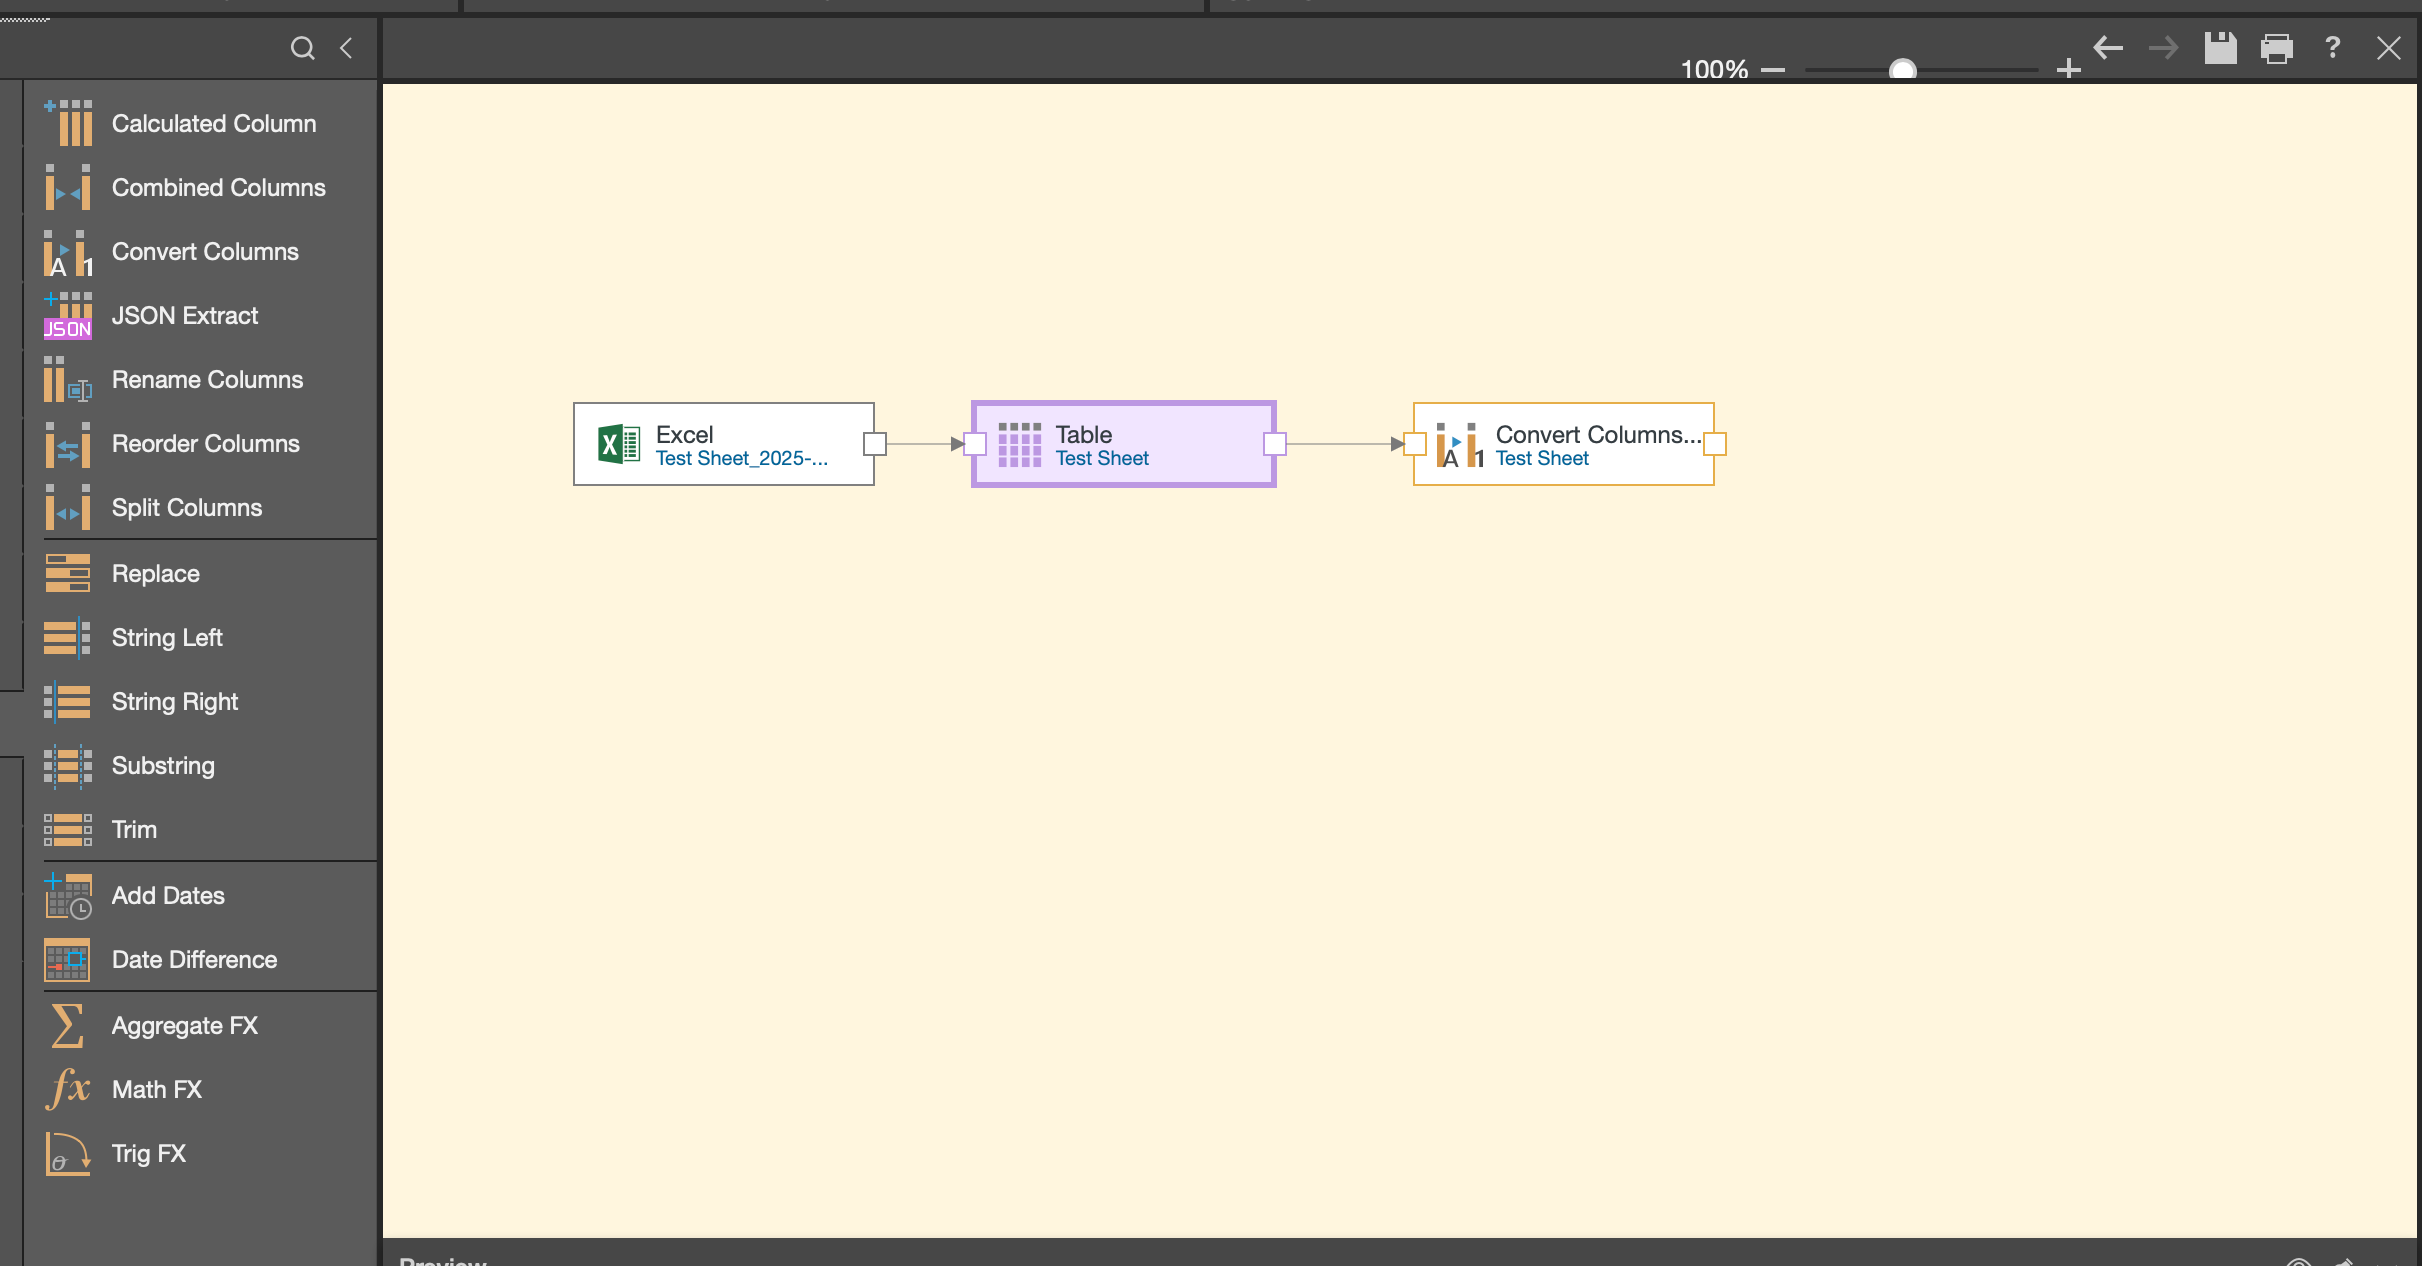
The column operations node provides a wealth of options to refine your table data. You can combine columns, create calculated columns via Python script, trim values, aggregate data, rename fields, or reorder columns for better organization.
For example, if you want to convert column types, simply drag the convert column node onto the canvas and connect it to your previous node to maintain the data flow.
When you select this node, the properties panel will update accordingly, giving you options to transform your column data types as needed.
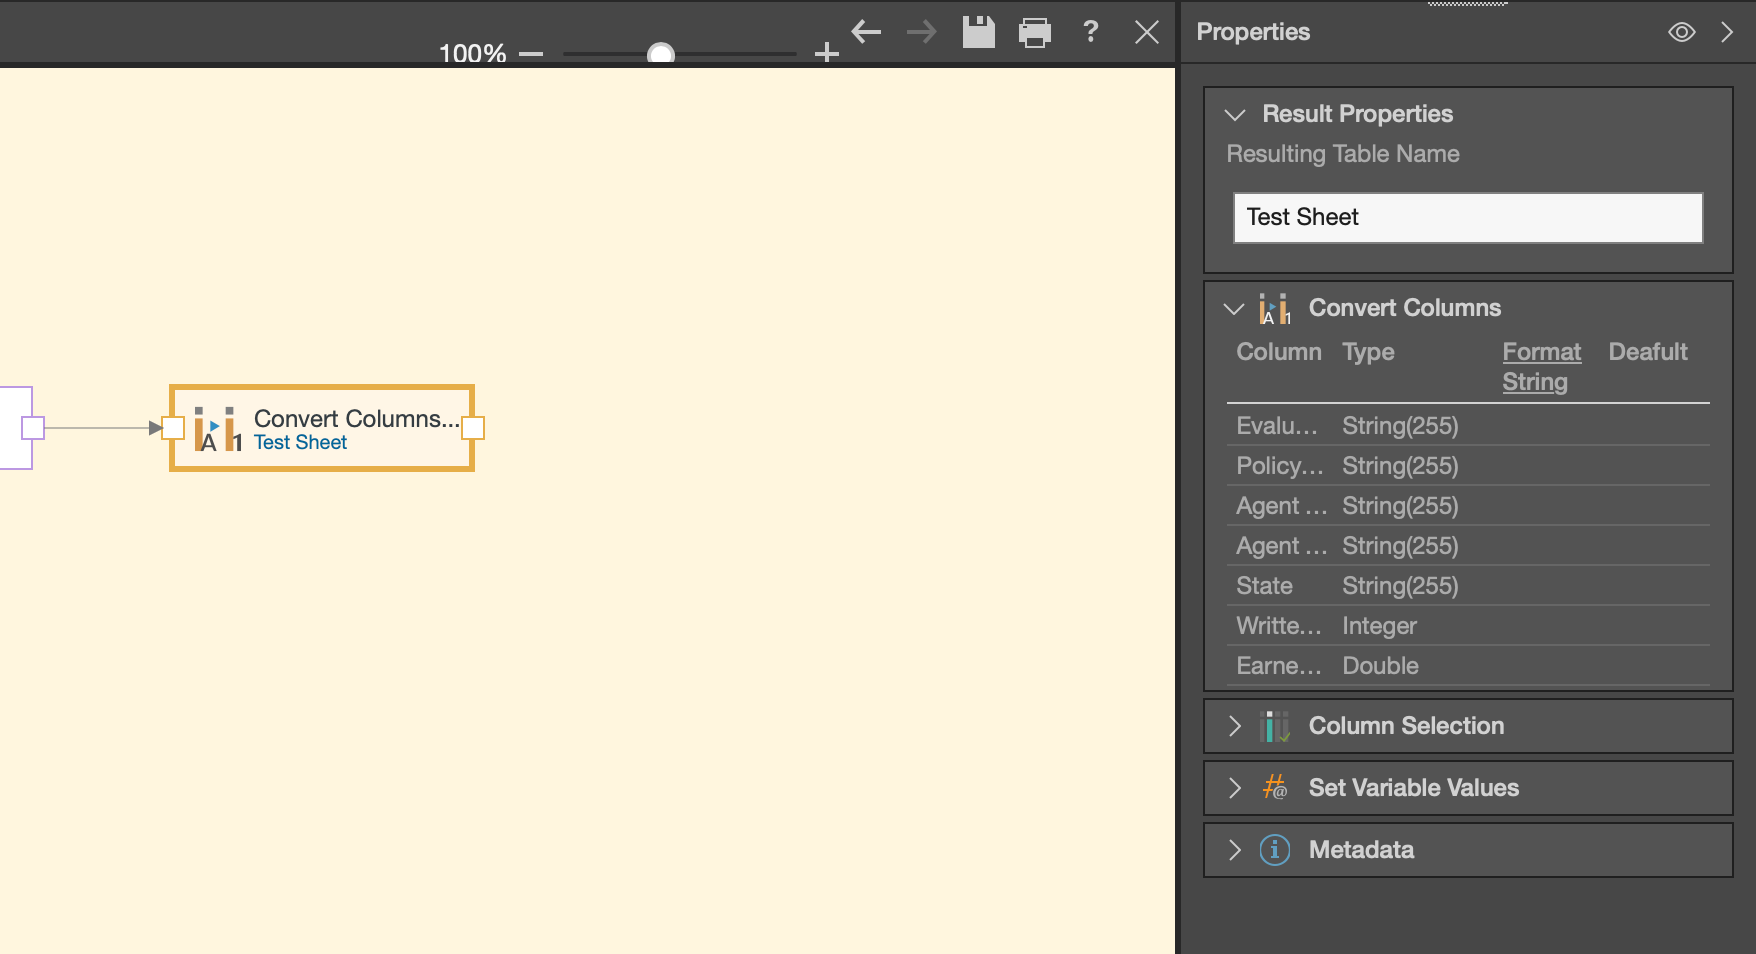
As you build your model, remember to connect each node to create a valid data flow. This ensures your data moves seamlessly through each transformation step.
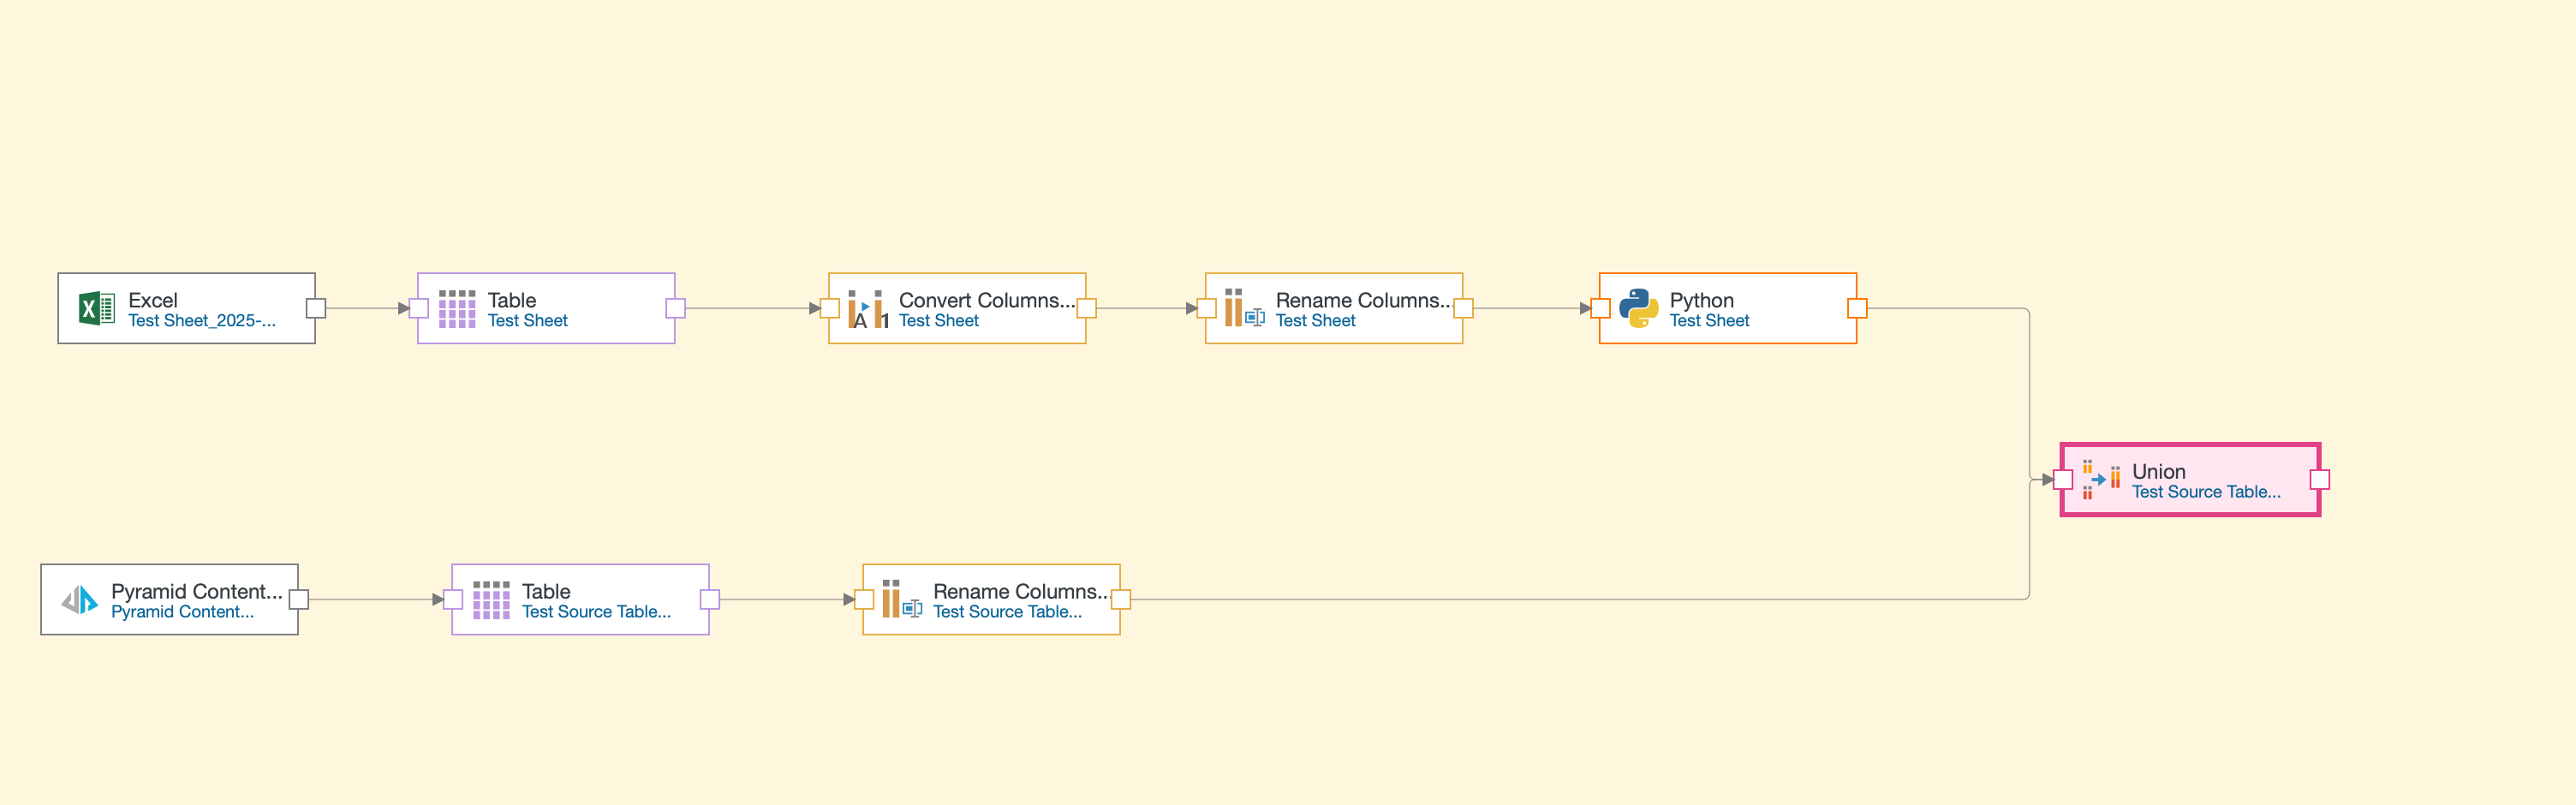
Joining Multiple Data Sources
One of the most powerful features in Model Pro is the ability to work with multiple data sources in a single model. You can bring in different data assets and join them together using the join node.
For instance, you might pull in a Cloverleaf report, customize its columns, and then join it with your Excel data. This flexibility allows you to create comprehensive models that draw from various data sources across your organization.
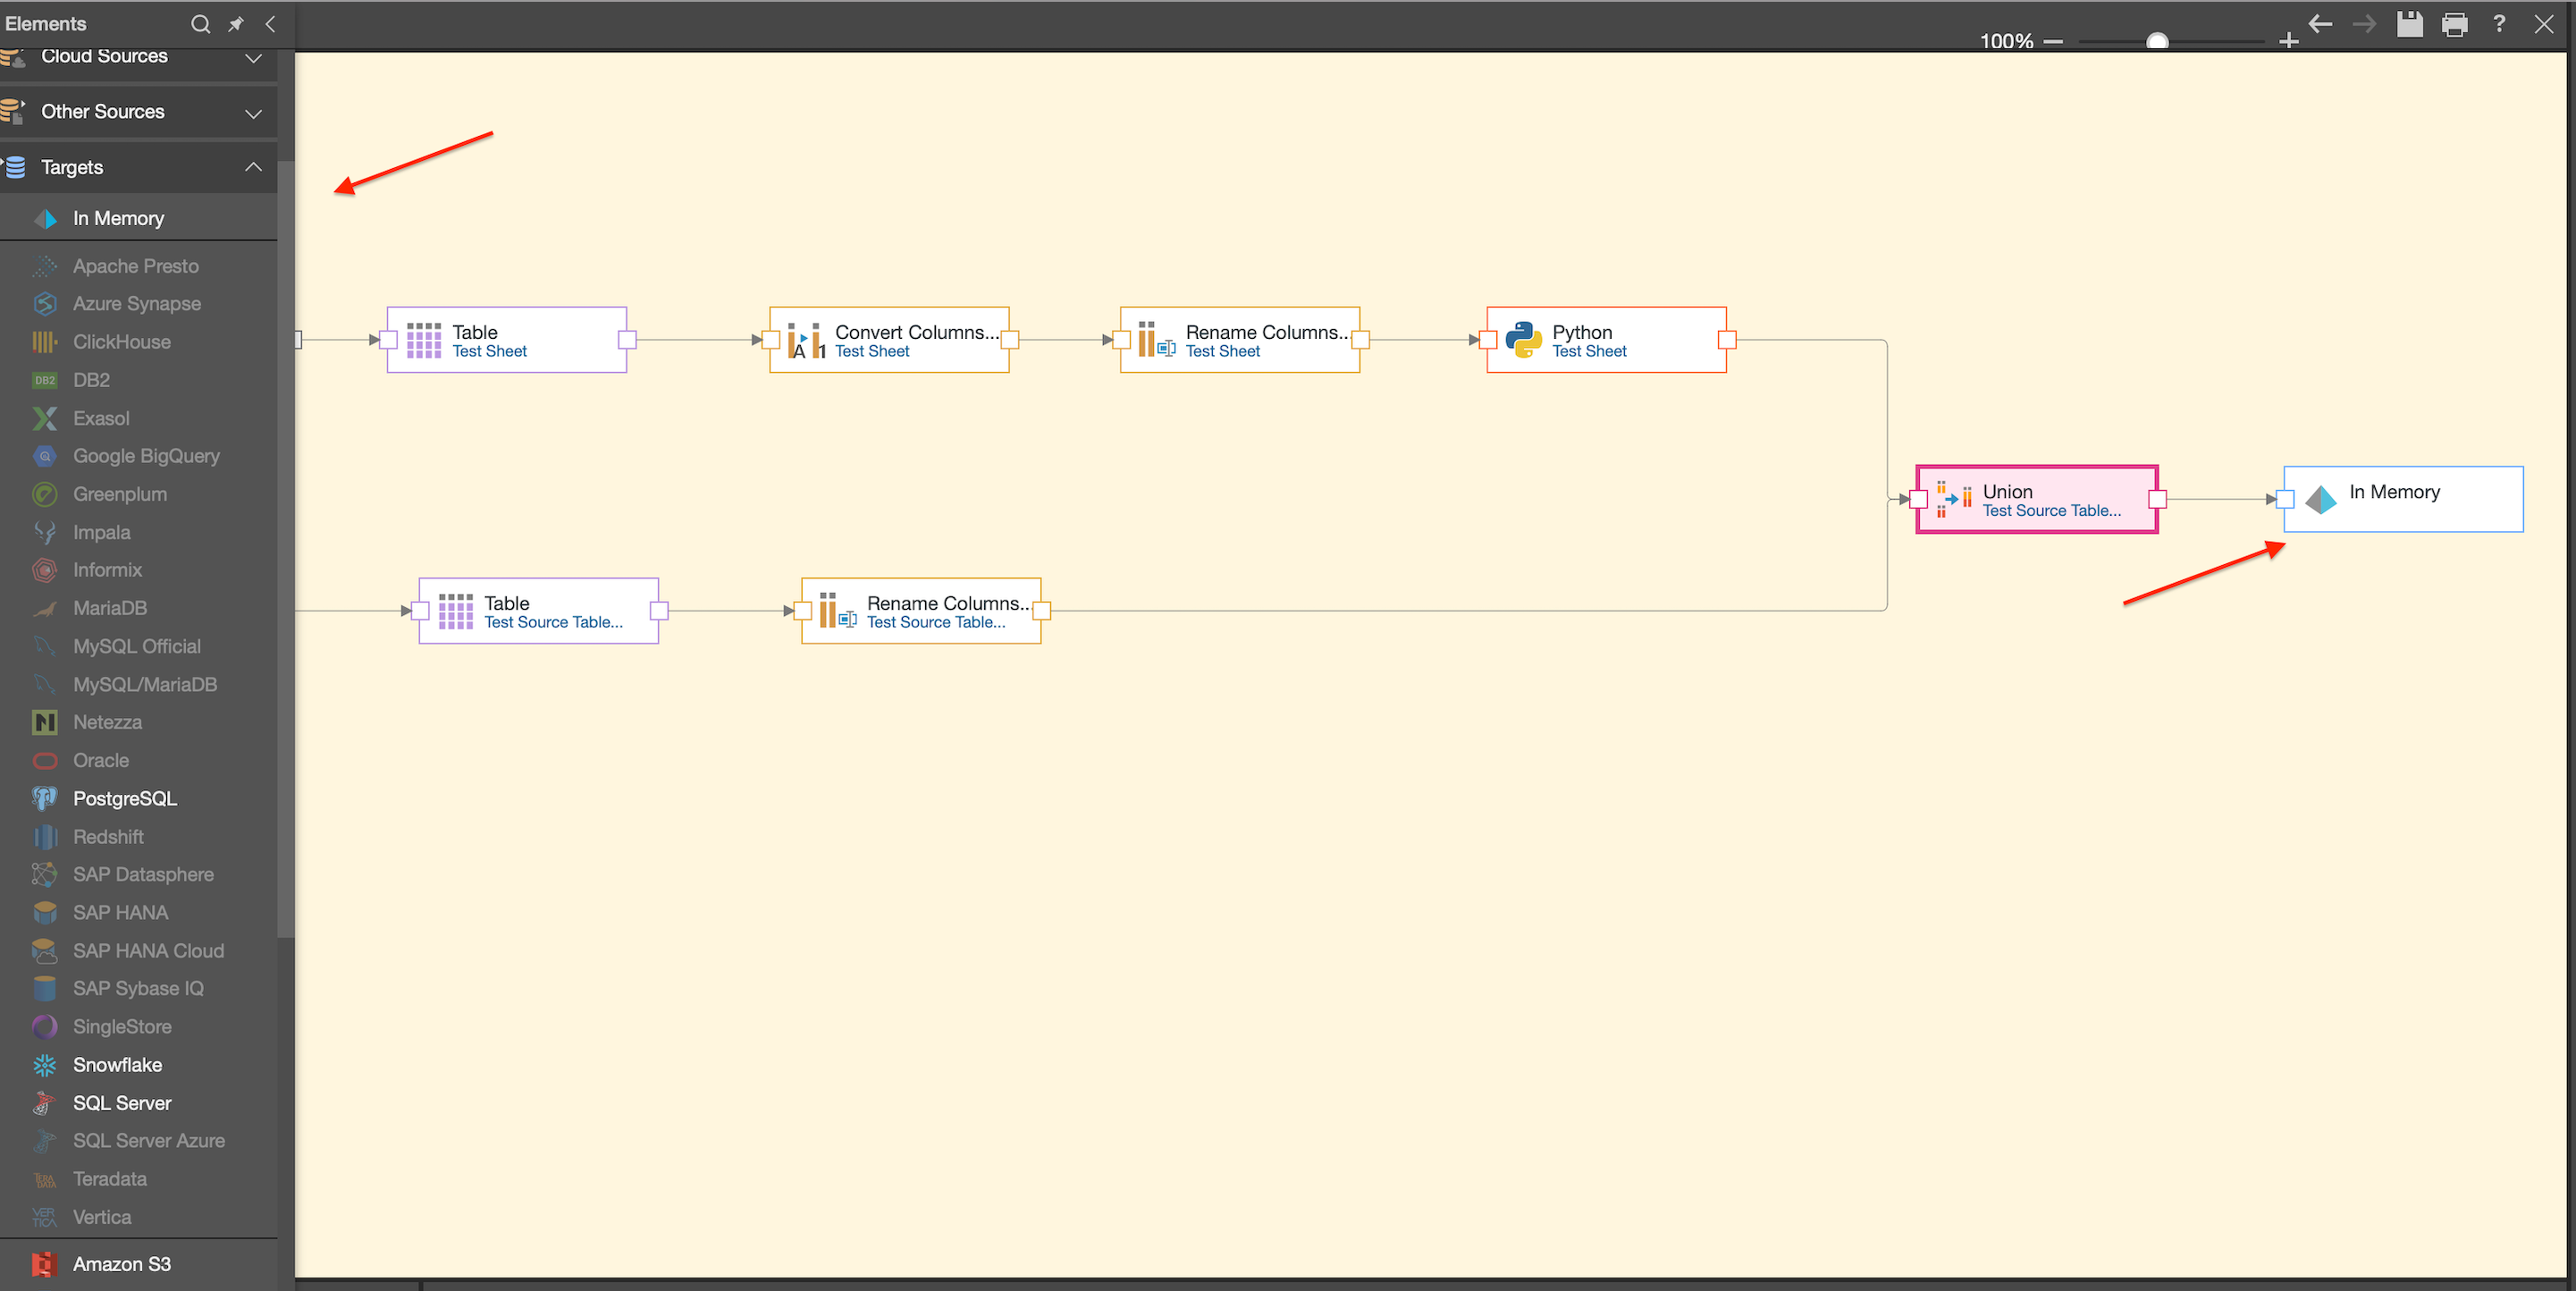
Finalizing Your Model
Once all your data is loaded and customized to your specifications, add a target node to give your data a destination. Target options include the same source data options reviewed previously. In many cases, pointing to Cloverleaf’s In-Memory storage provides optimal performance.
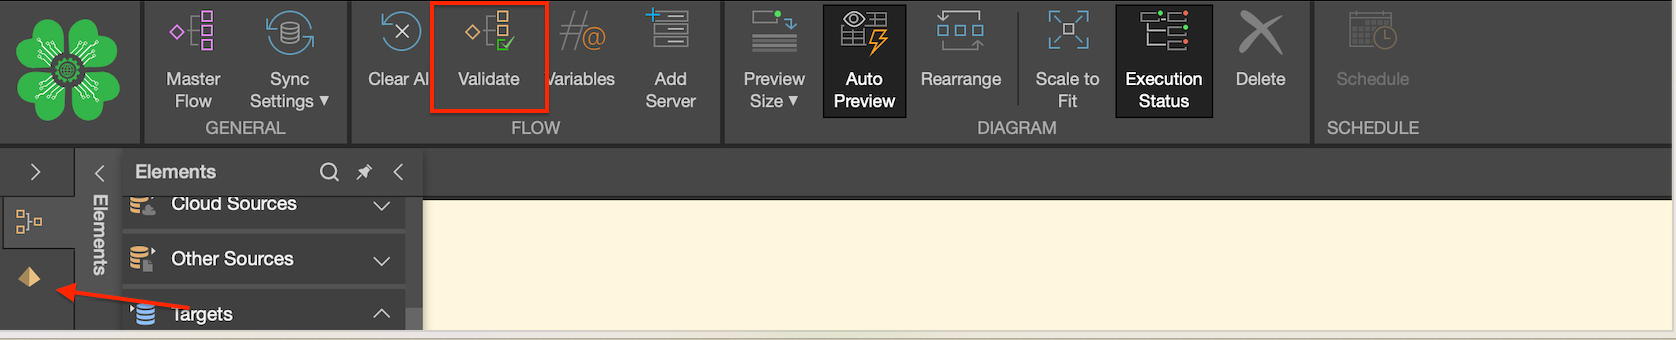
After adding your target, validate your data flow using the validation option highlighted below. Once successfully validated, your data flow is complete, and you can open the model by selecting the Cloverleaf icon.
A Final Note
I’ve seen firsthand how applying these modeling principles can transform complex data relationships into streamlined, effective analytics models. When your data models are thoughtfully designed, your organization spends less time preparing data and more time gaining valuable insights.
I hope these tips help you create data models that not only function efficiently but also effectively support your insurance data analytics story. Remember, the goal isn’t just to process information—it’s to structure it in a way that inspires understanding and action.
Check out our Platform section for more details on our services.